
Resilience
The Resilience area of the Global Trade Control Tower maps how materials flow from your upstream suppliers into your finished products, and shows where your revenue and spend depend on specific suppliers, materials, and countries. It helps you find concentration risk — single-source suppliers and bottlenecks — and weigh it against the business it affects, so you can plan ahead and respond quickly when a supplier or region is disrupted.
When to use Resilience
- When you need to know which of your products depend on a given supplier, material, or country.
- When you want to find single-source suppliers or bottlenecks in your sub-tier.
- When a world event affects a region or supplier and you need to assess your exposure quickly.
- When you're prioritizing resilience actions and want to rank them by the revenue and spend they protect.
Before you start
- The Resilience component must be enabled for your tenant. Availability depends on how your organization is set up.
- Your supply-chain data must be uploaded with the supply-chain data template and processed.
- Product revenue and spend data sharpen the business-impact view.
How it works
Resilience is organized into three views: Exposures, Material Flows (which traces how materials move upstream into your products), and Events (early access). Most analysis starts in Exposures — the steps below walk through it.
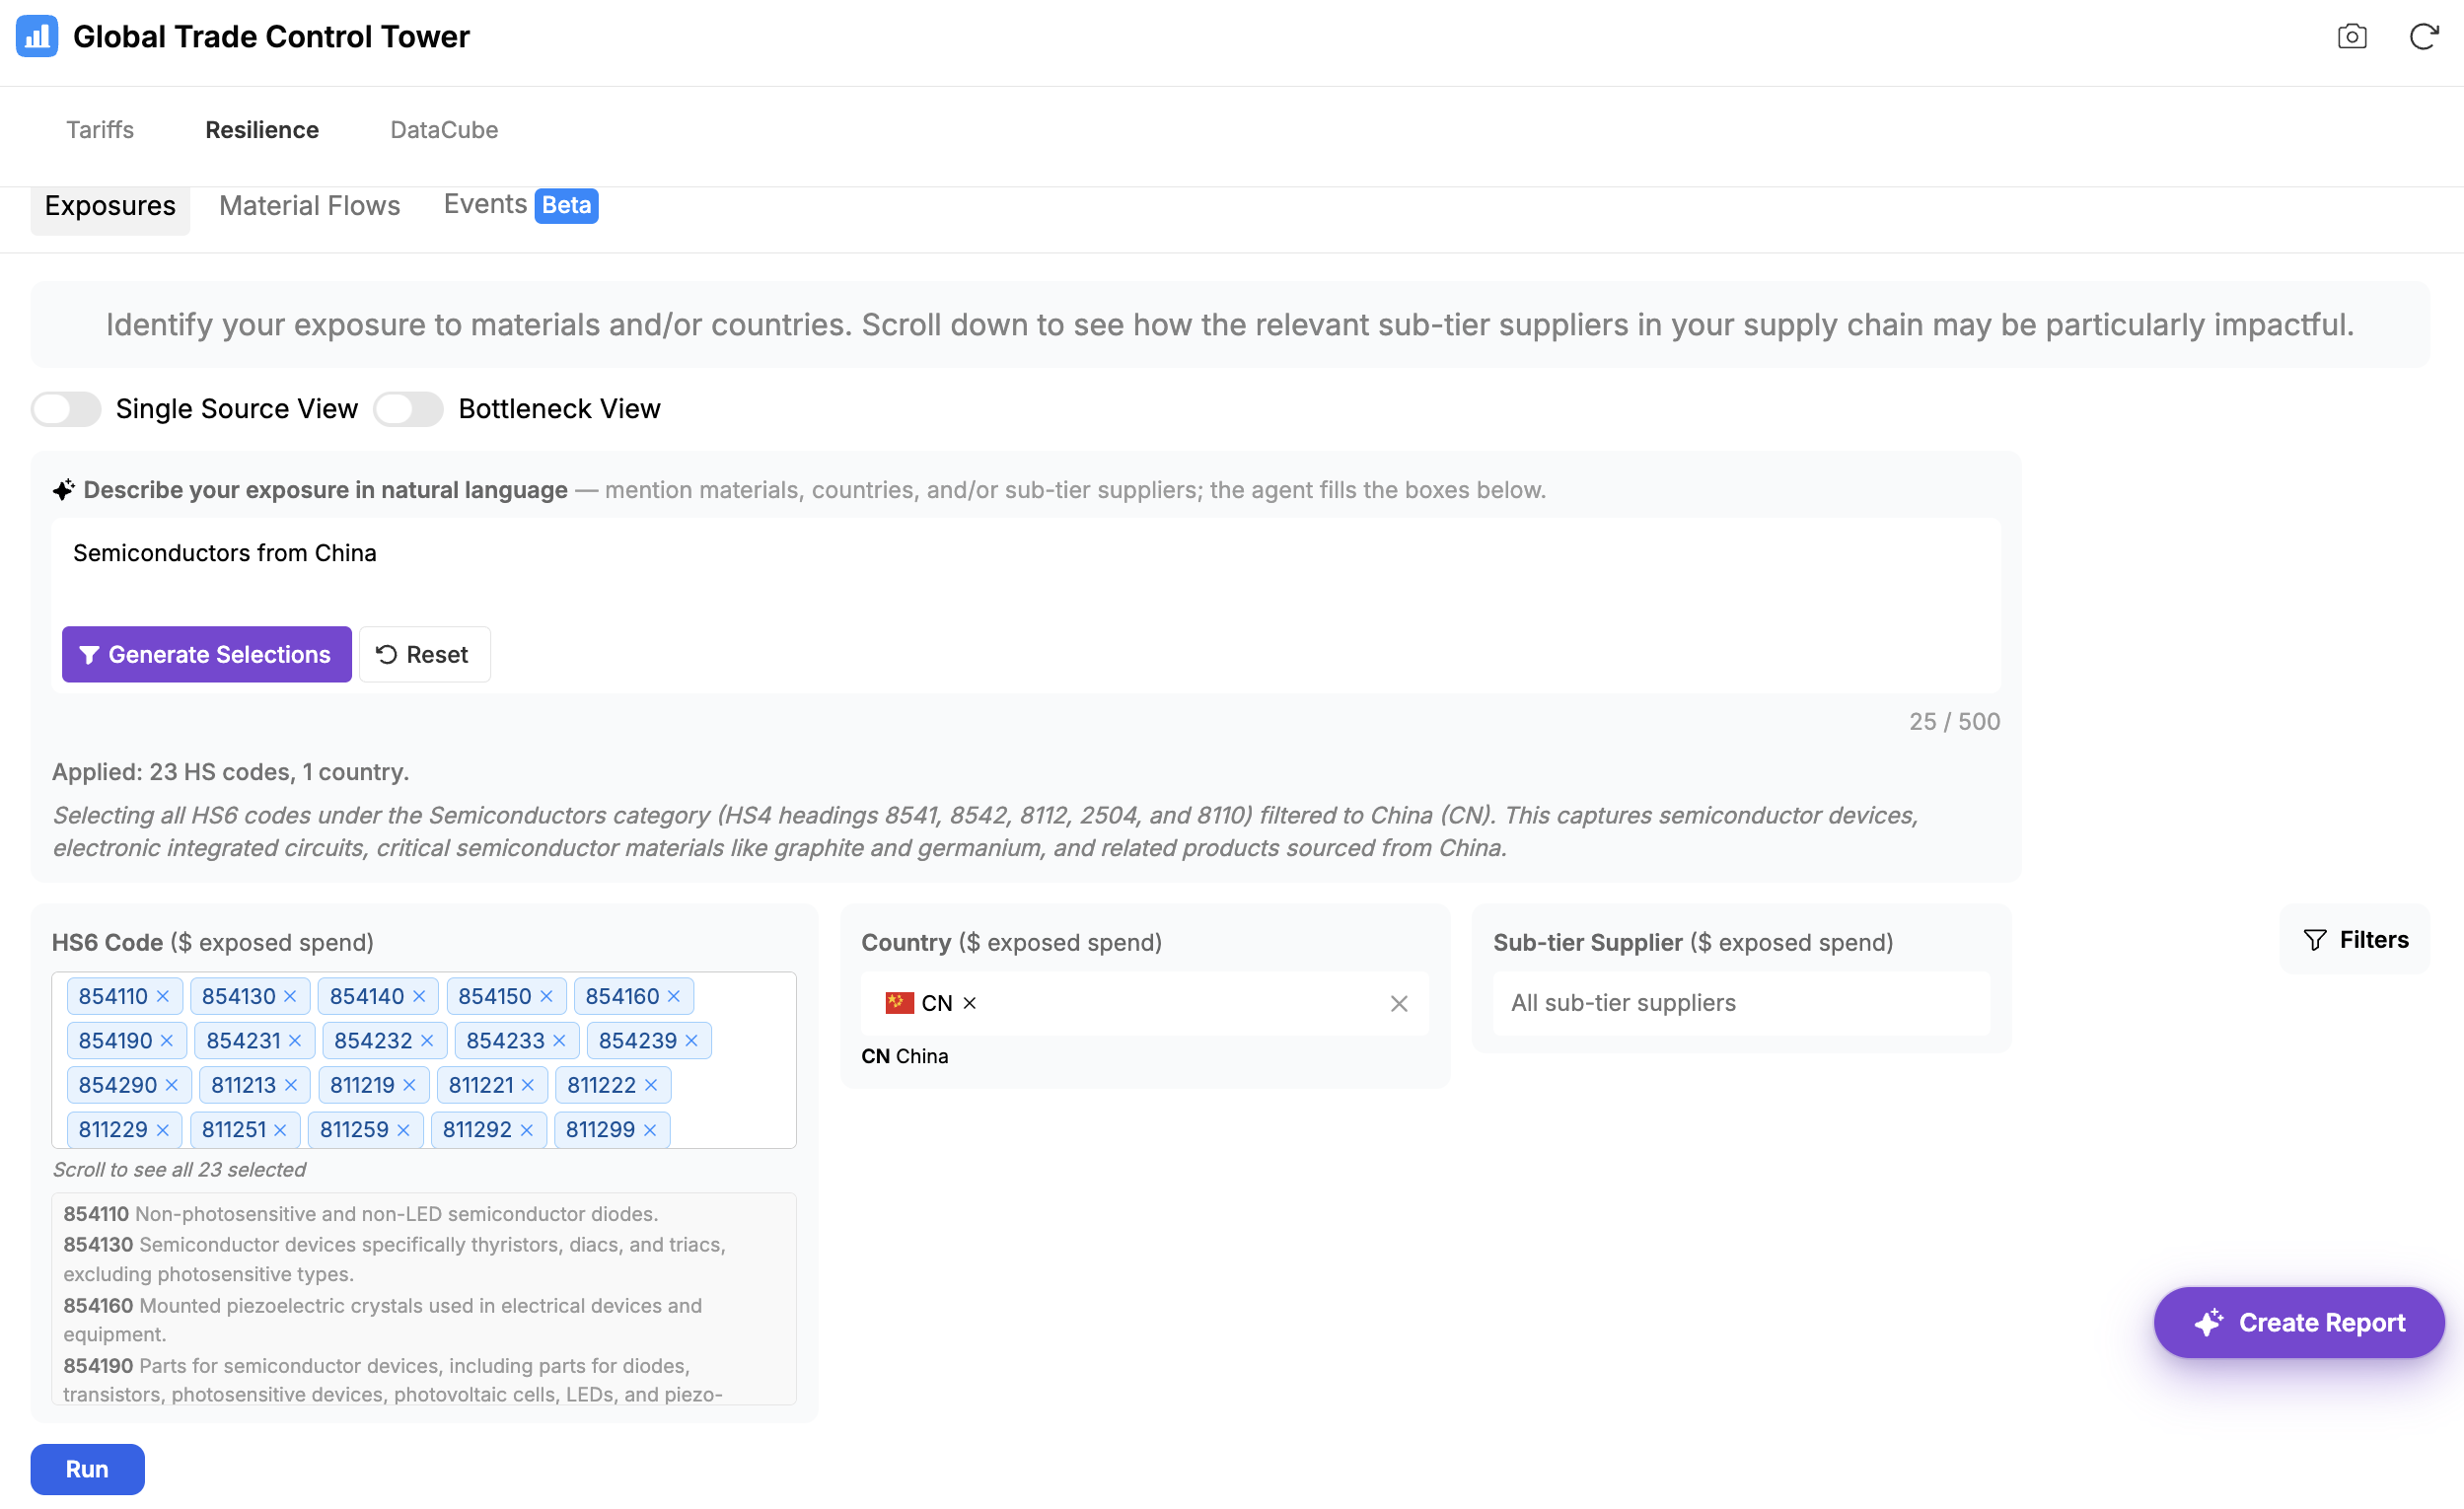
Find exposures using natural language
Describe what you want to examine in plain language — a material, country, or sub-tier supplier — and the agent fills the HS6 Code, Country, and Sub-tier Supplier selectors for you (you can also set them directly). Then run the analysis.
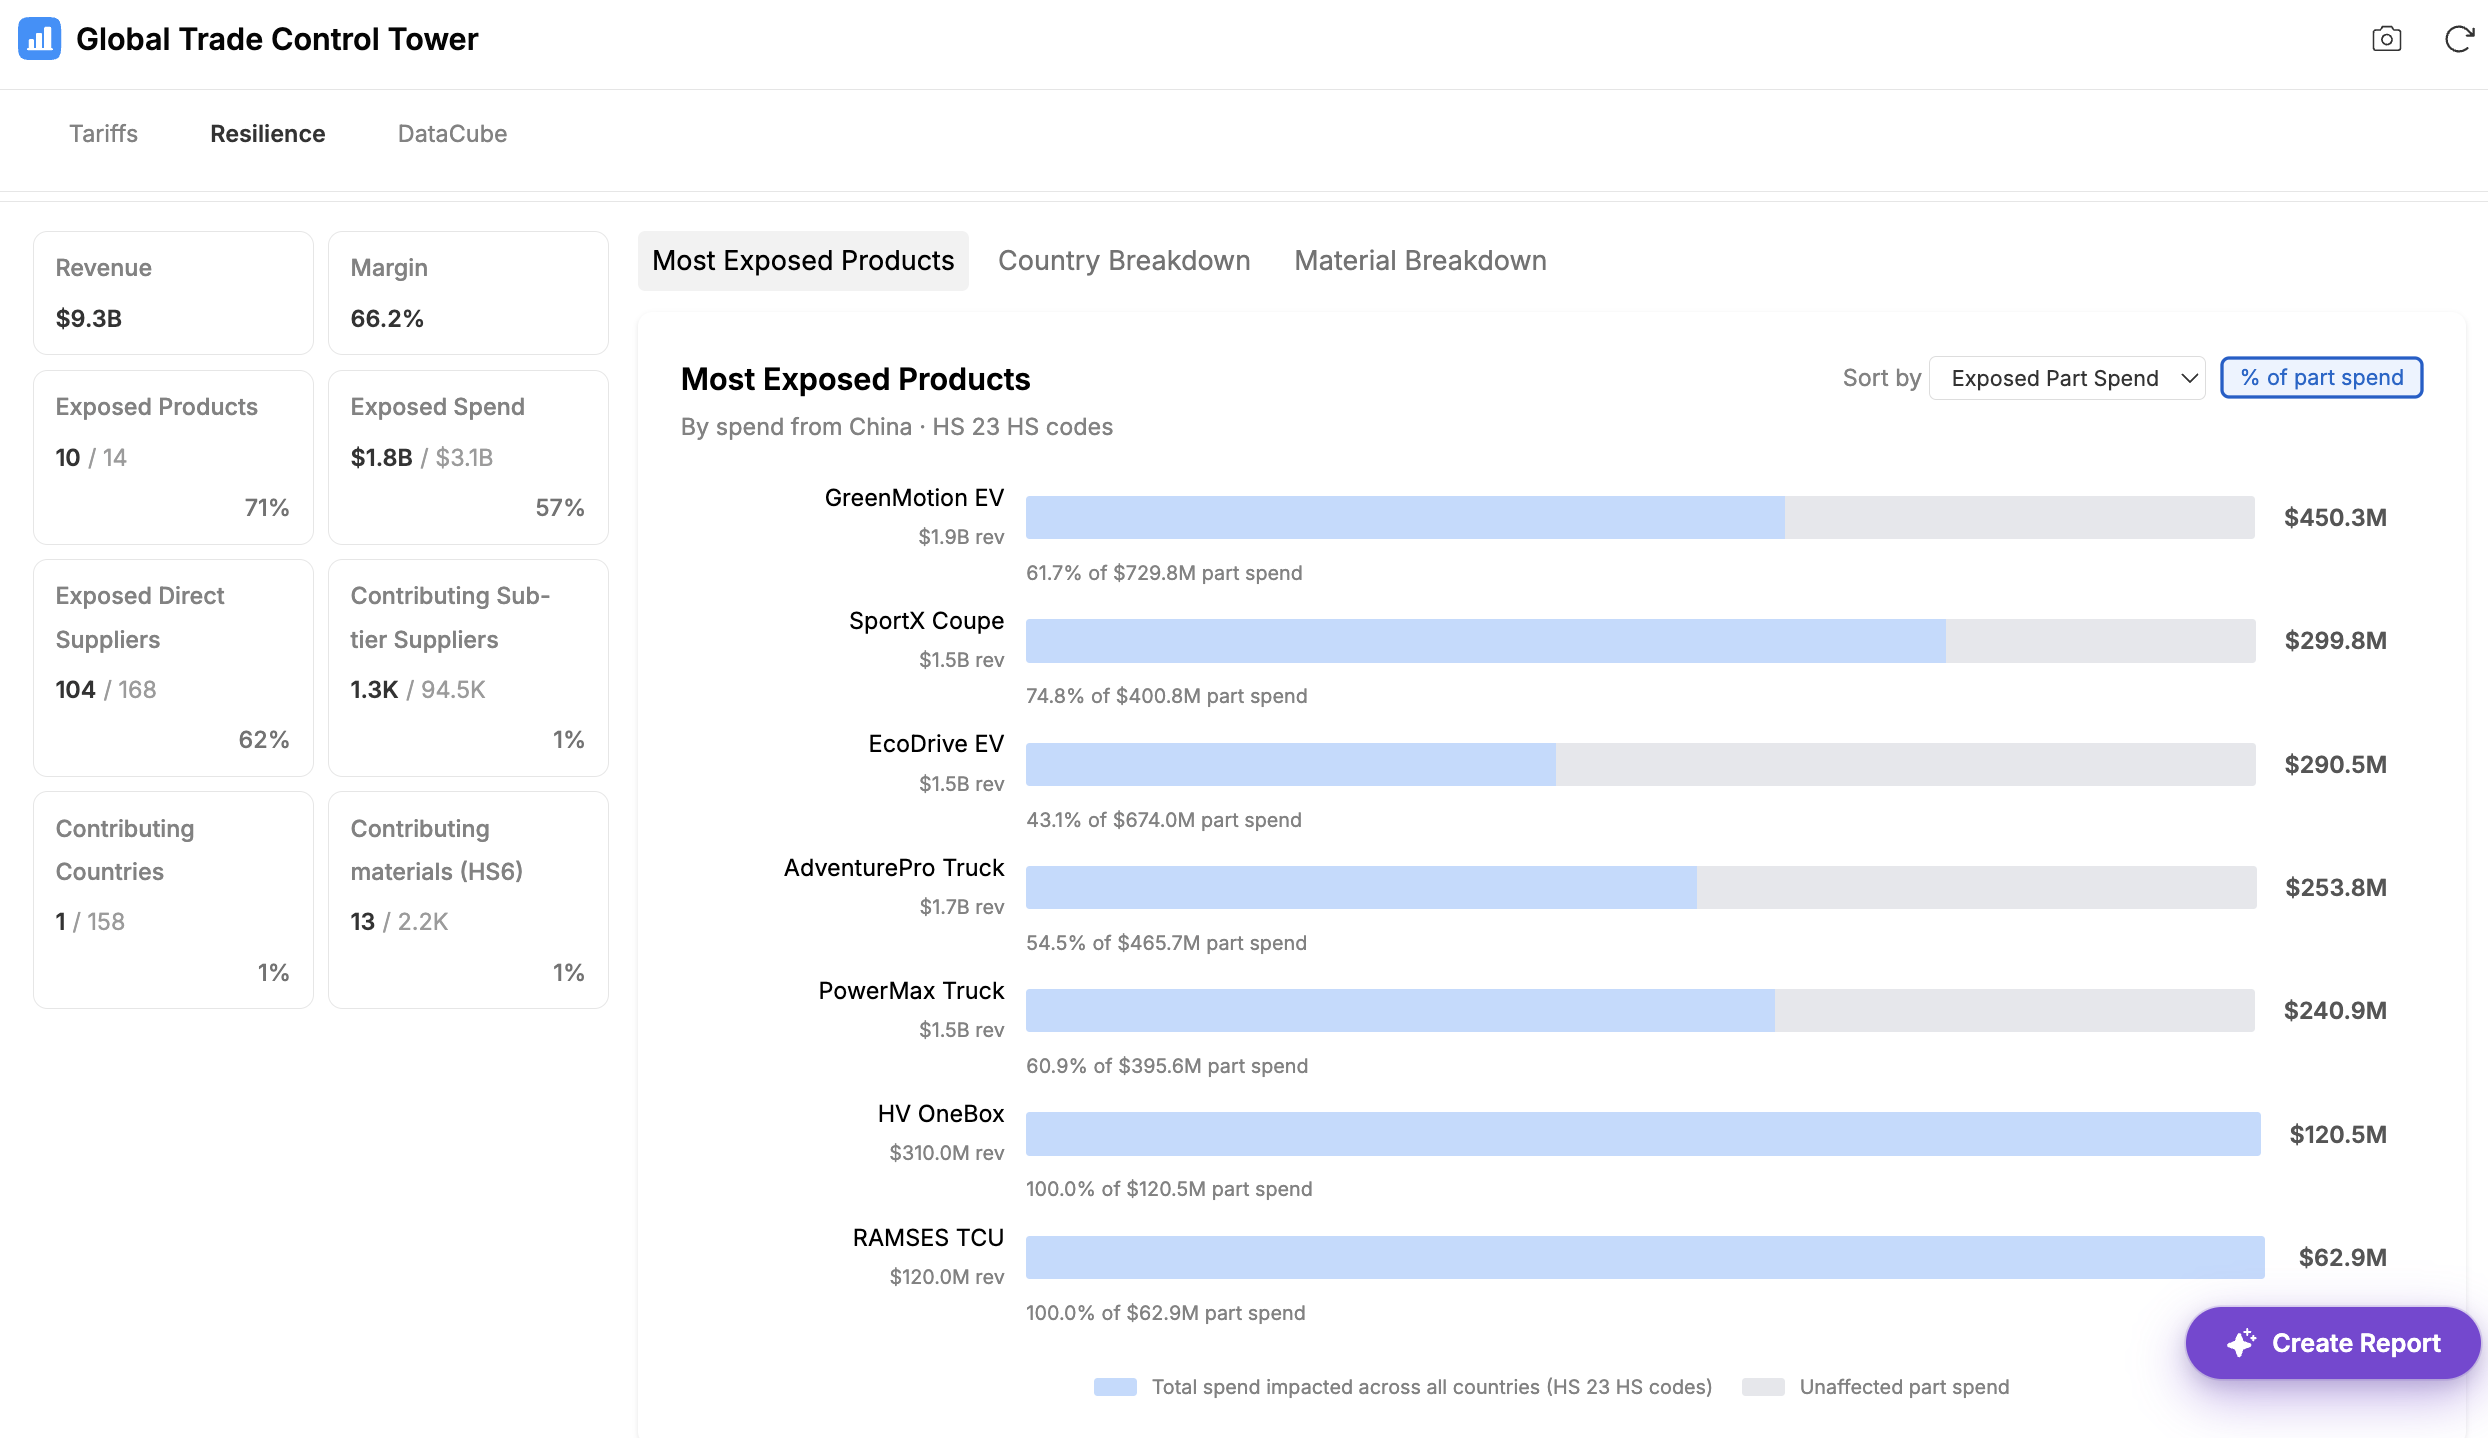
View aggregate exposure by product, material, and country
Summary cards show how much revenue and spend is exposed and how many products, suppliers, countries, and materials contribute. Break the most exposed products down by Country or Material.
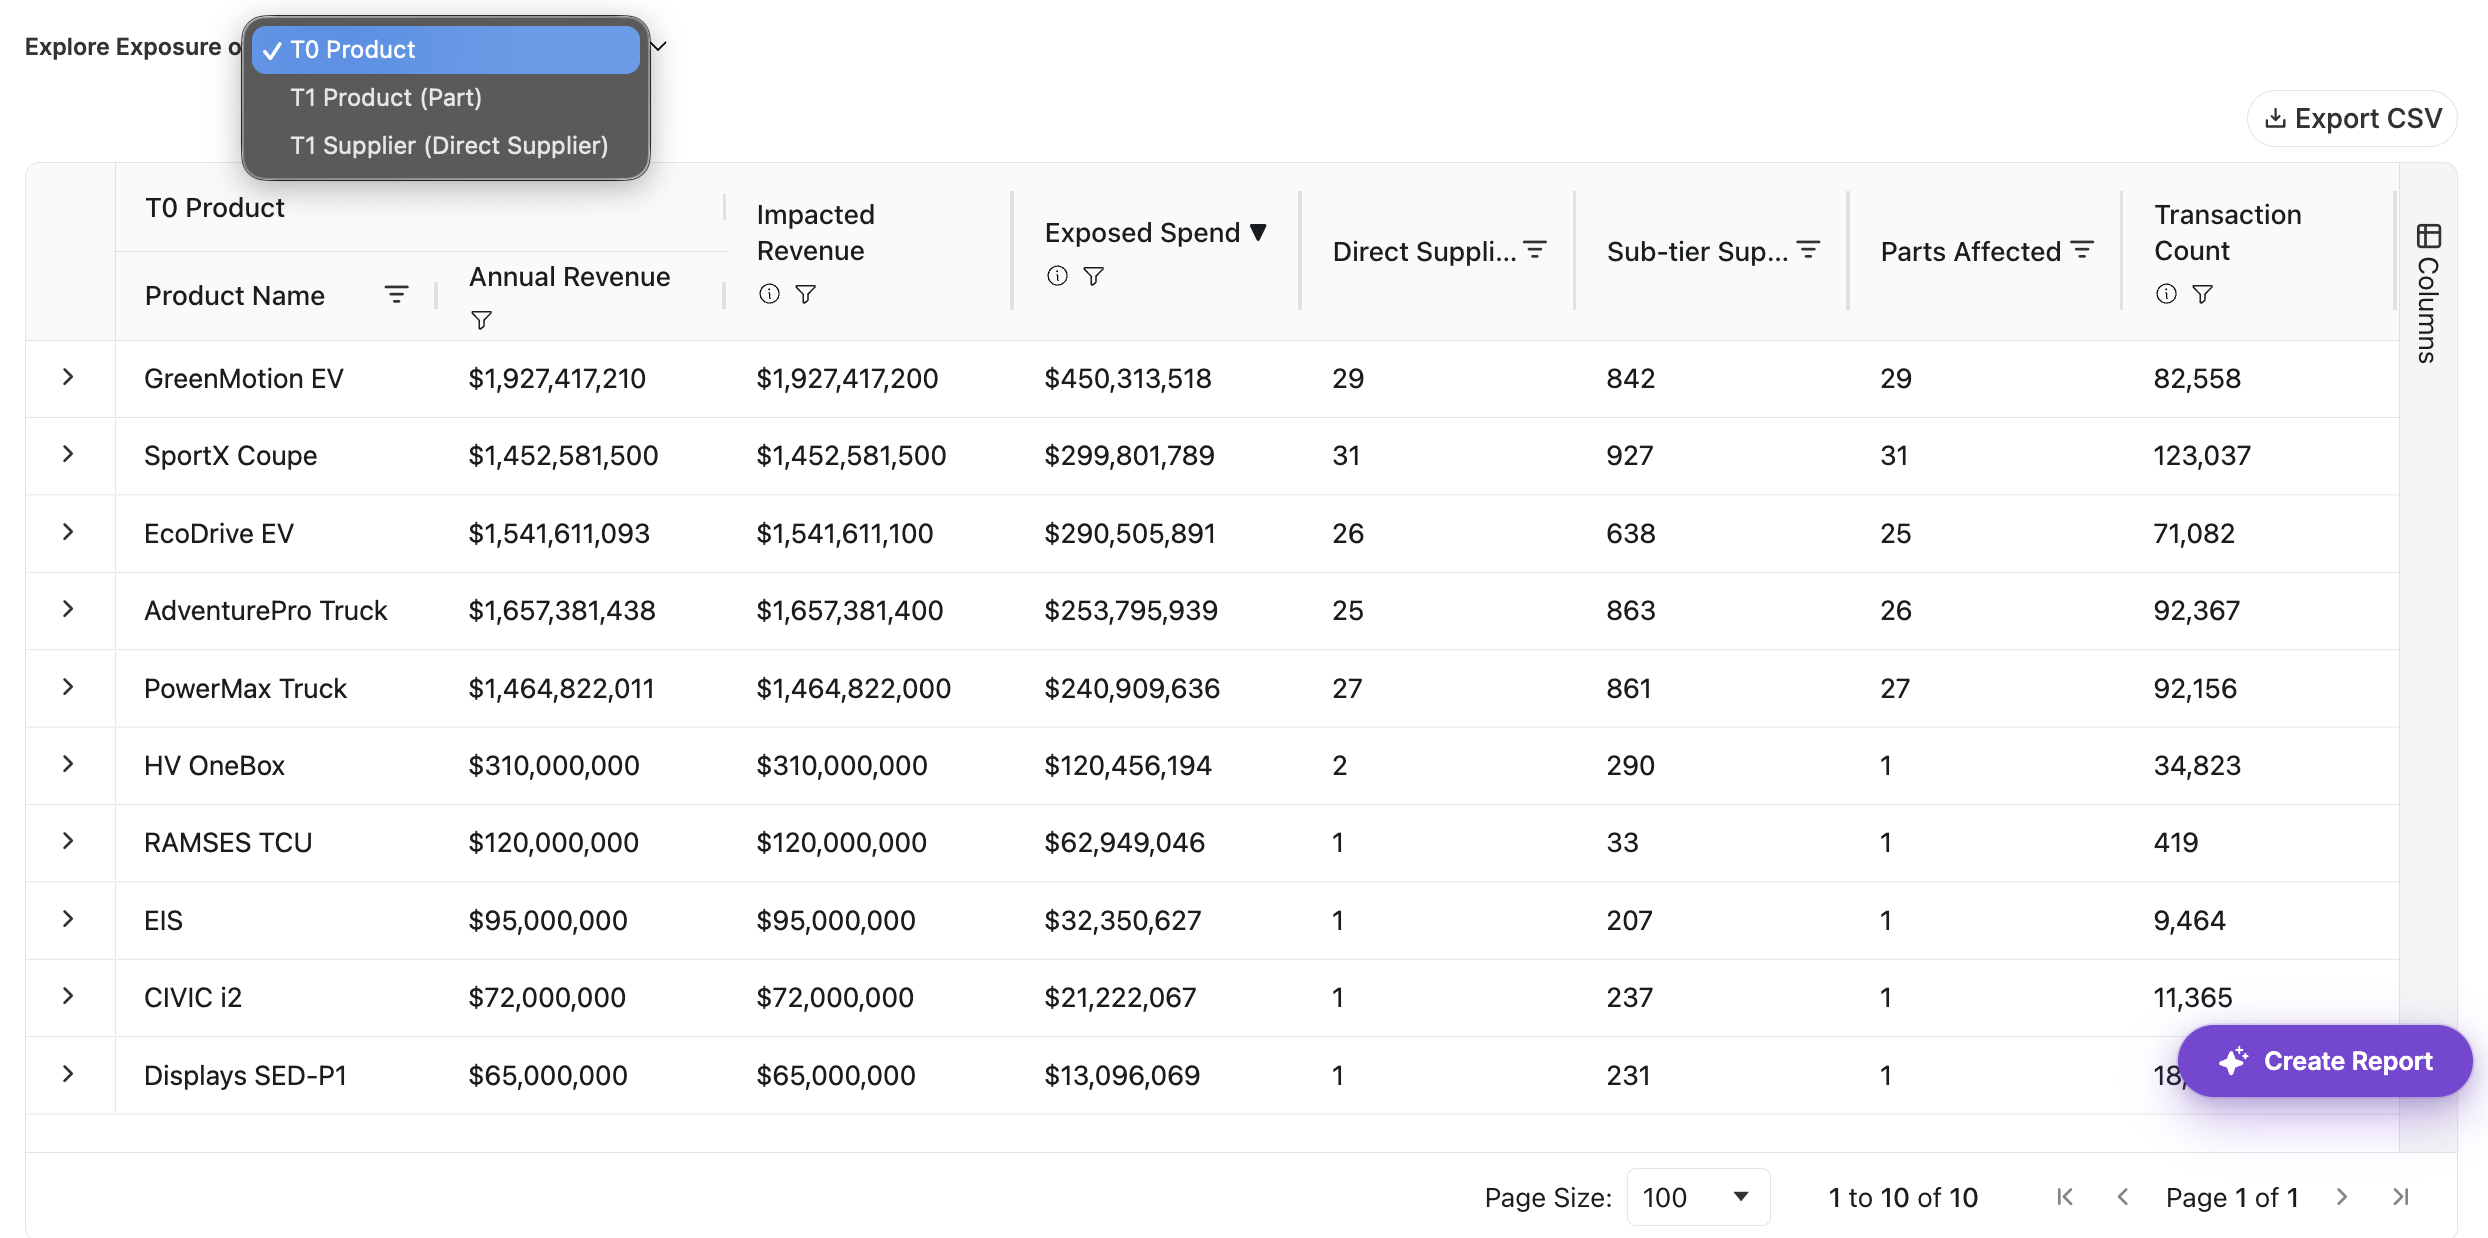
Explore exposure by product, part, or direct supplier
Switch between your finished products, the parts that compose them, and your direct suppliers to see impacted revenue, exposed spend, and how many suppliers and parts are affected.
Focus on concentration risk
Turn on Single Source View to focus on materials with a single source, or Bottleneck View to focus on bottleneck sub-tier suppliers from your configured table.


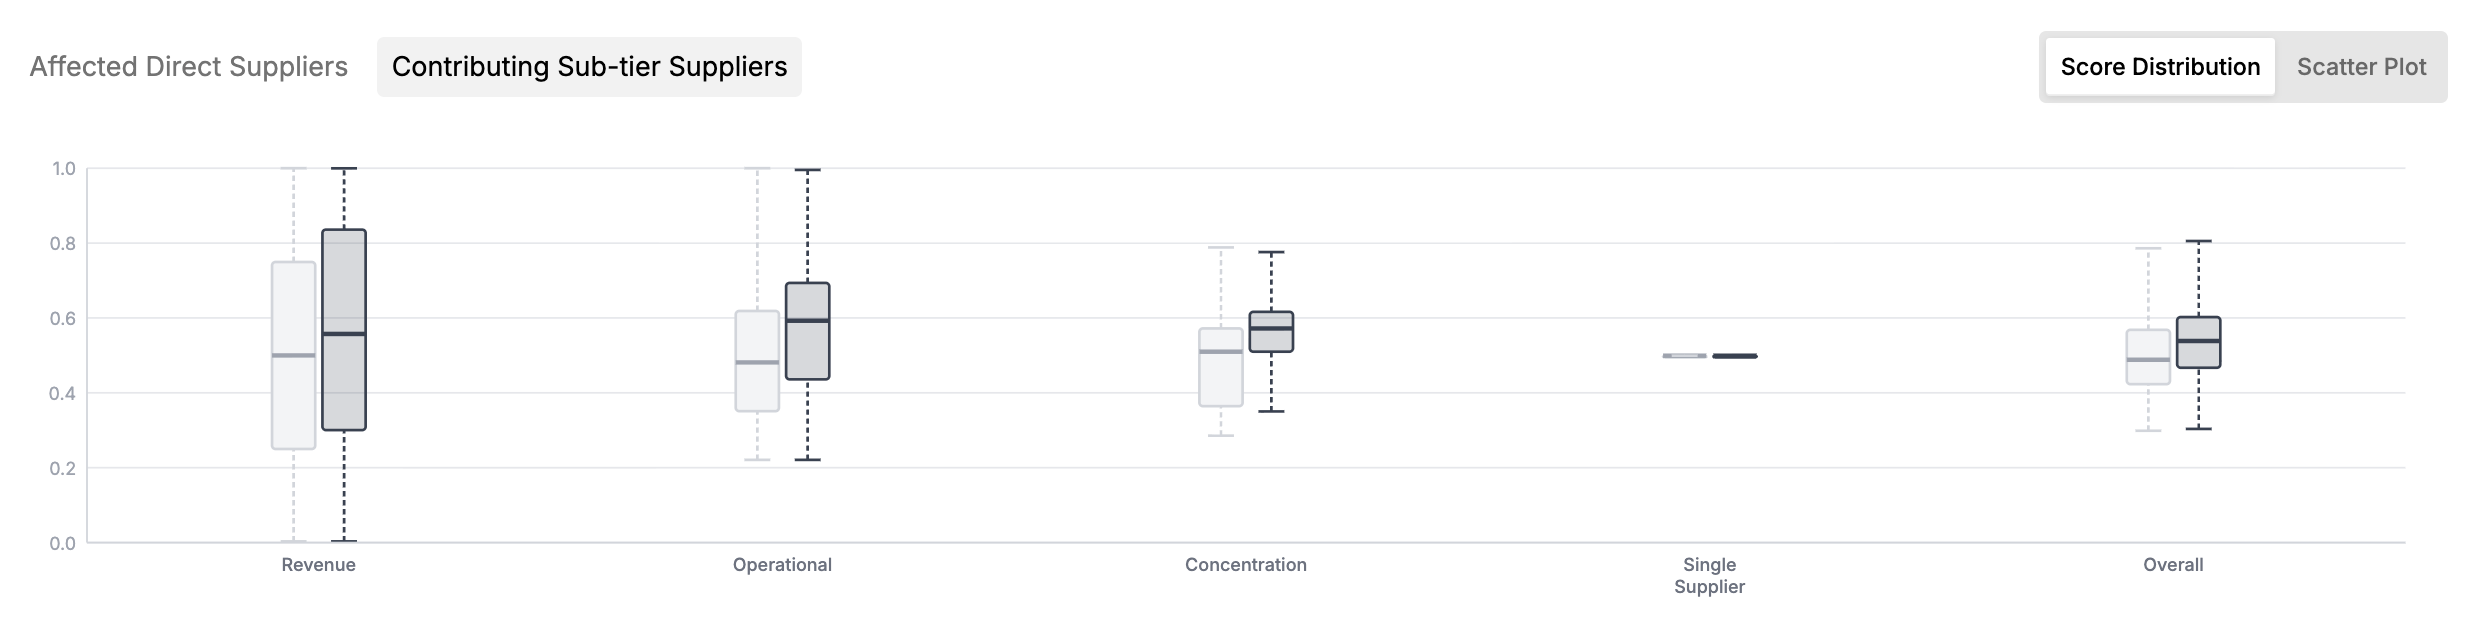
Compare supplier risk-score distributions
Compare how supplier risk scores — revenue, operational, concentration, single-supplier, and overall — are distributed across all suppliers versus the ones you've selected.
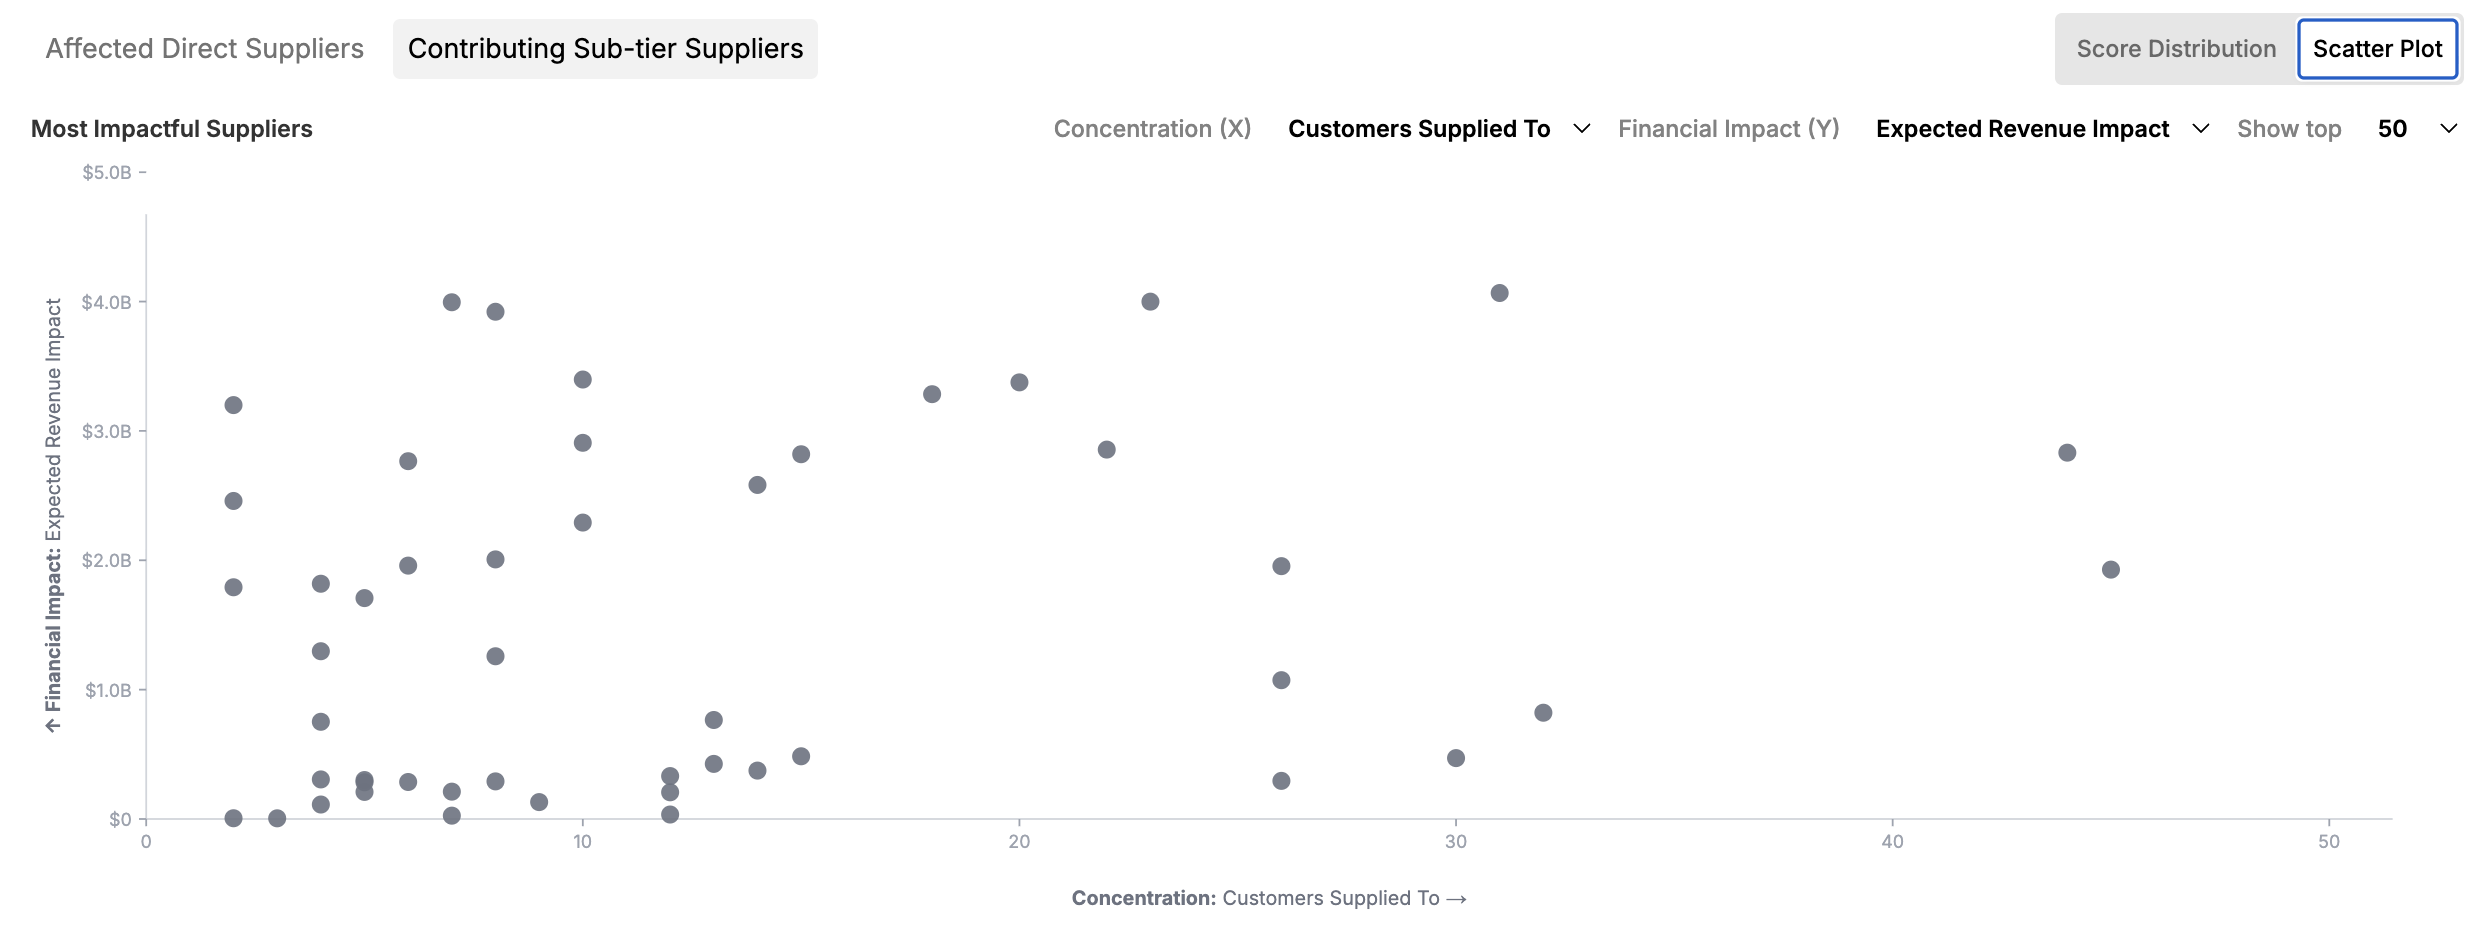
Find the most impactful suppliers
Rank sub-tier suppliers by expected revenue impact and how many of your products depend on them, so you can prioritize the relationships that carry the most risk.
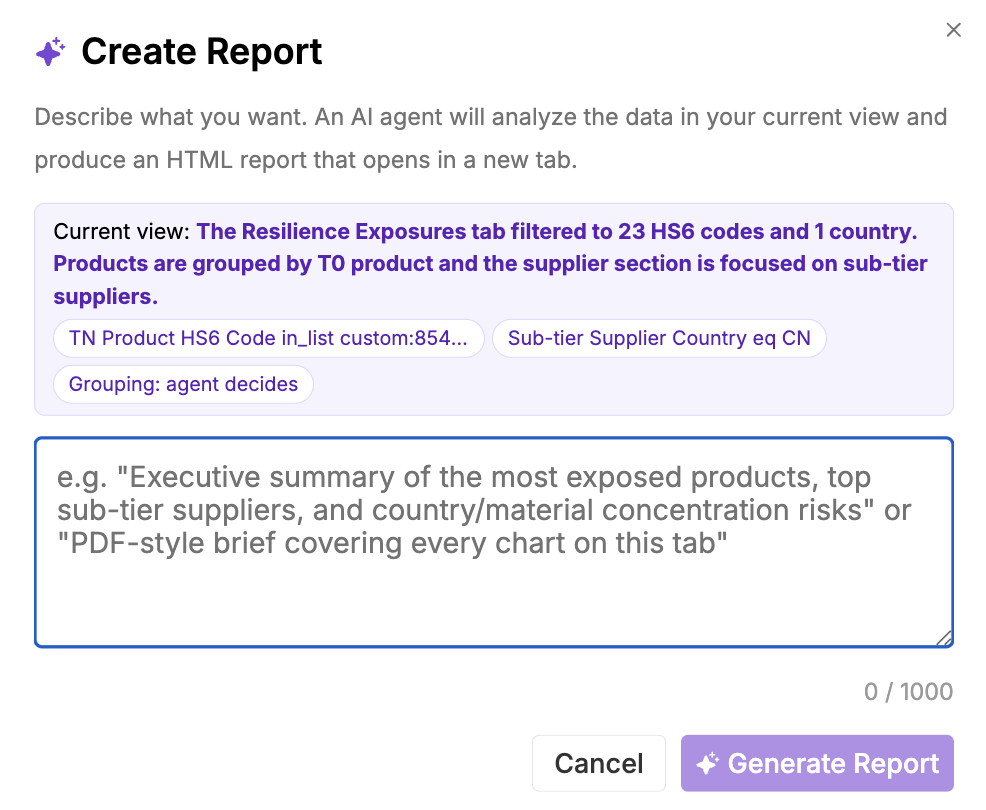
Create a report
Describe the report you want, and an agent analyzes your current view and produces a shareable report that opens in a new tab.
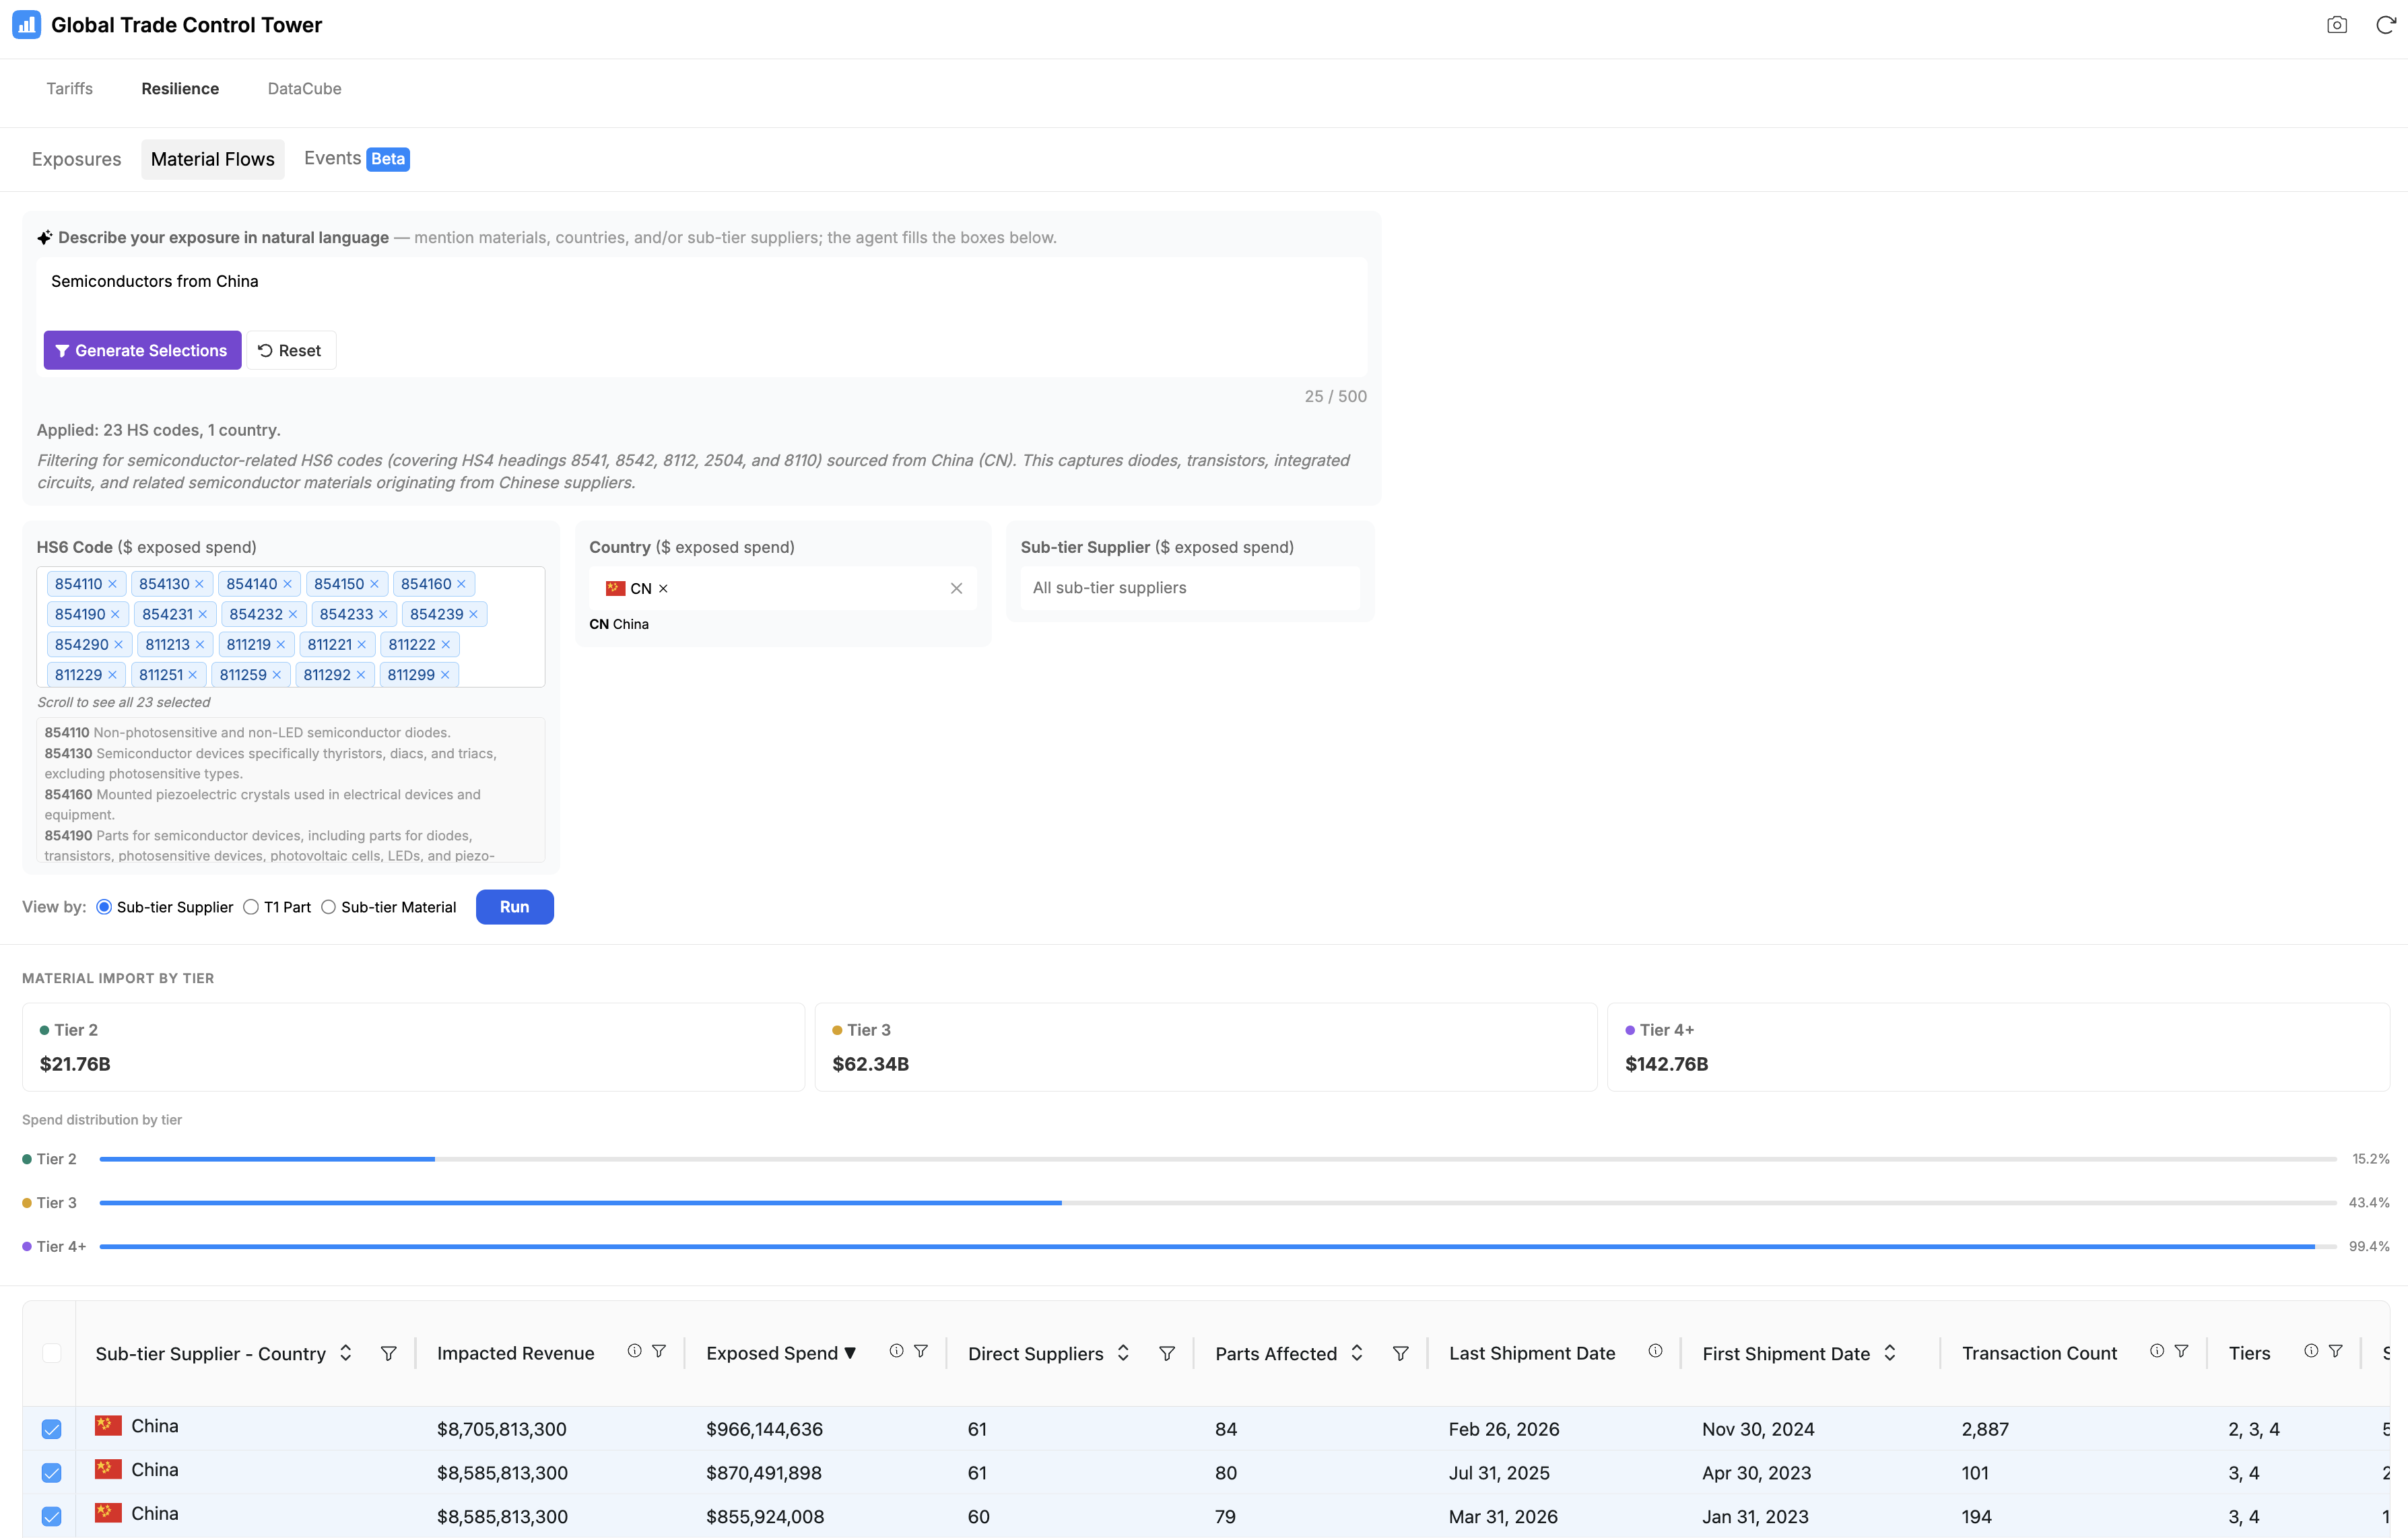
Trace material flows through the sub-tier
Switch to the Material Flows view to see how the materials you selected reach your products across tiers — the spend concentrated at each tier, and the sub-tier suppliers, parts, or materials behind it.
Analyze and review supply paths
Examine the specific paths a material takes from your product down through the tiers and countries involved. An experimental AI evaluation flags each path's validity and criticality and raises key questions, and you can add your own context and re-evaluate.
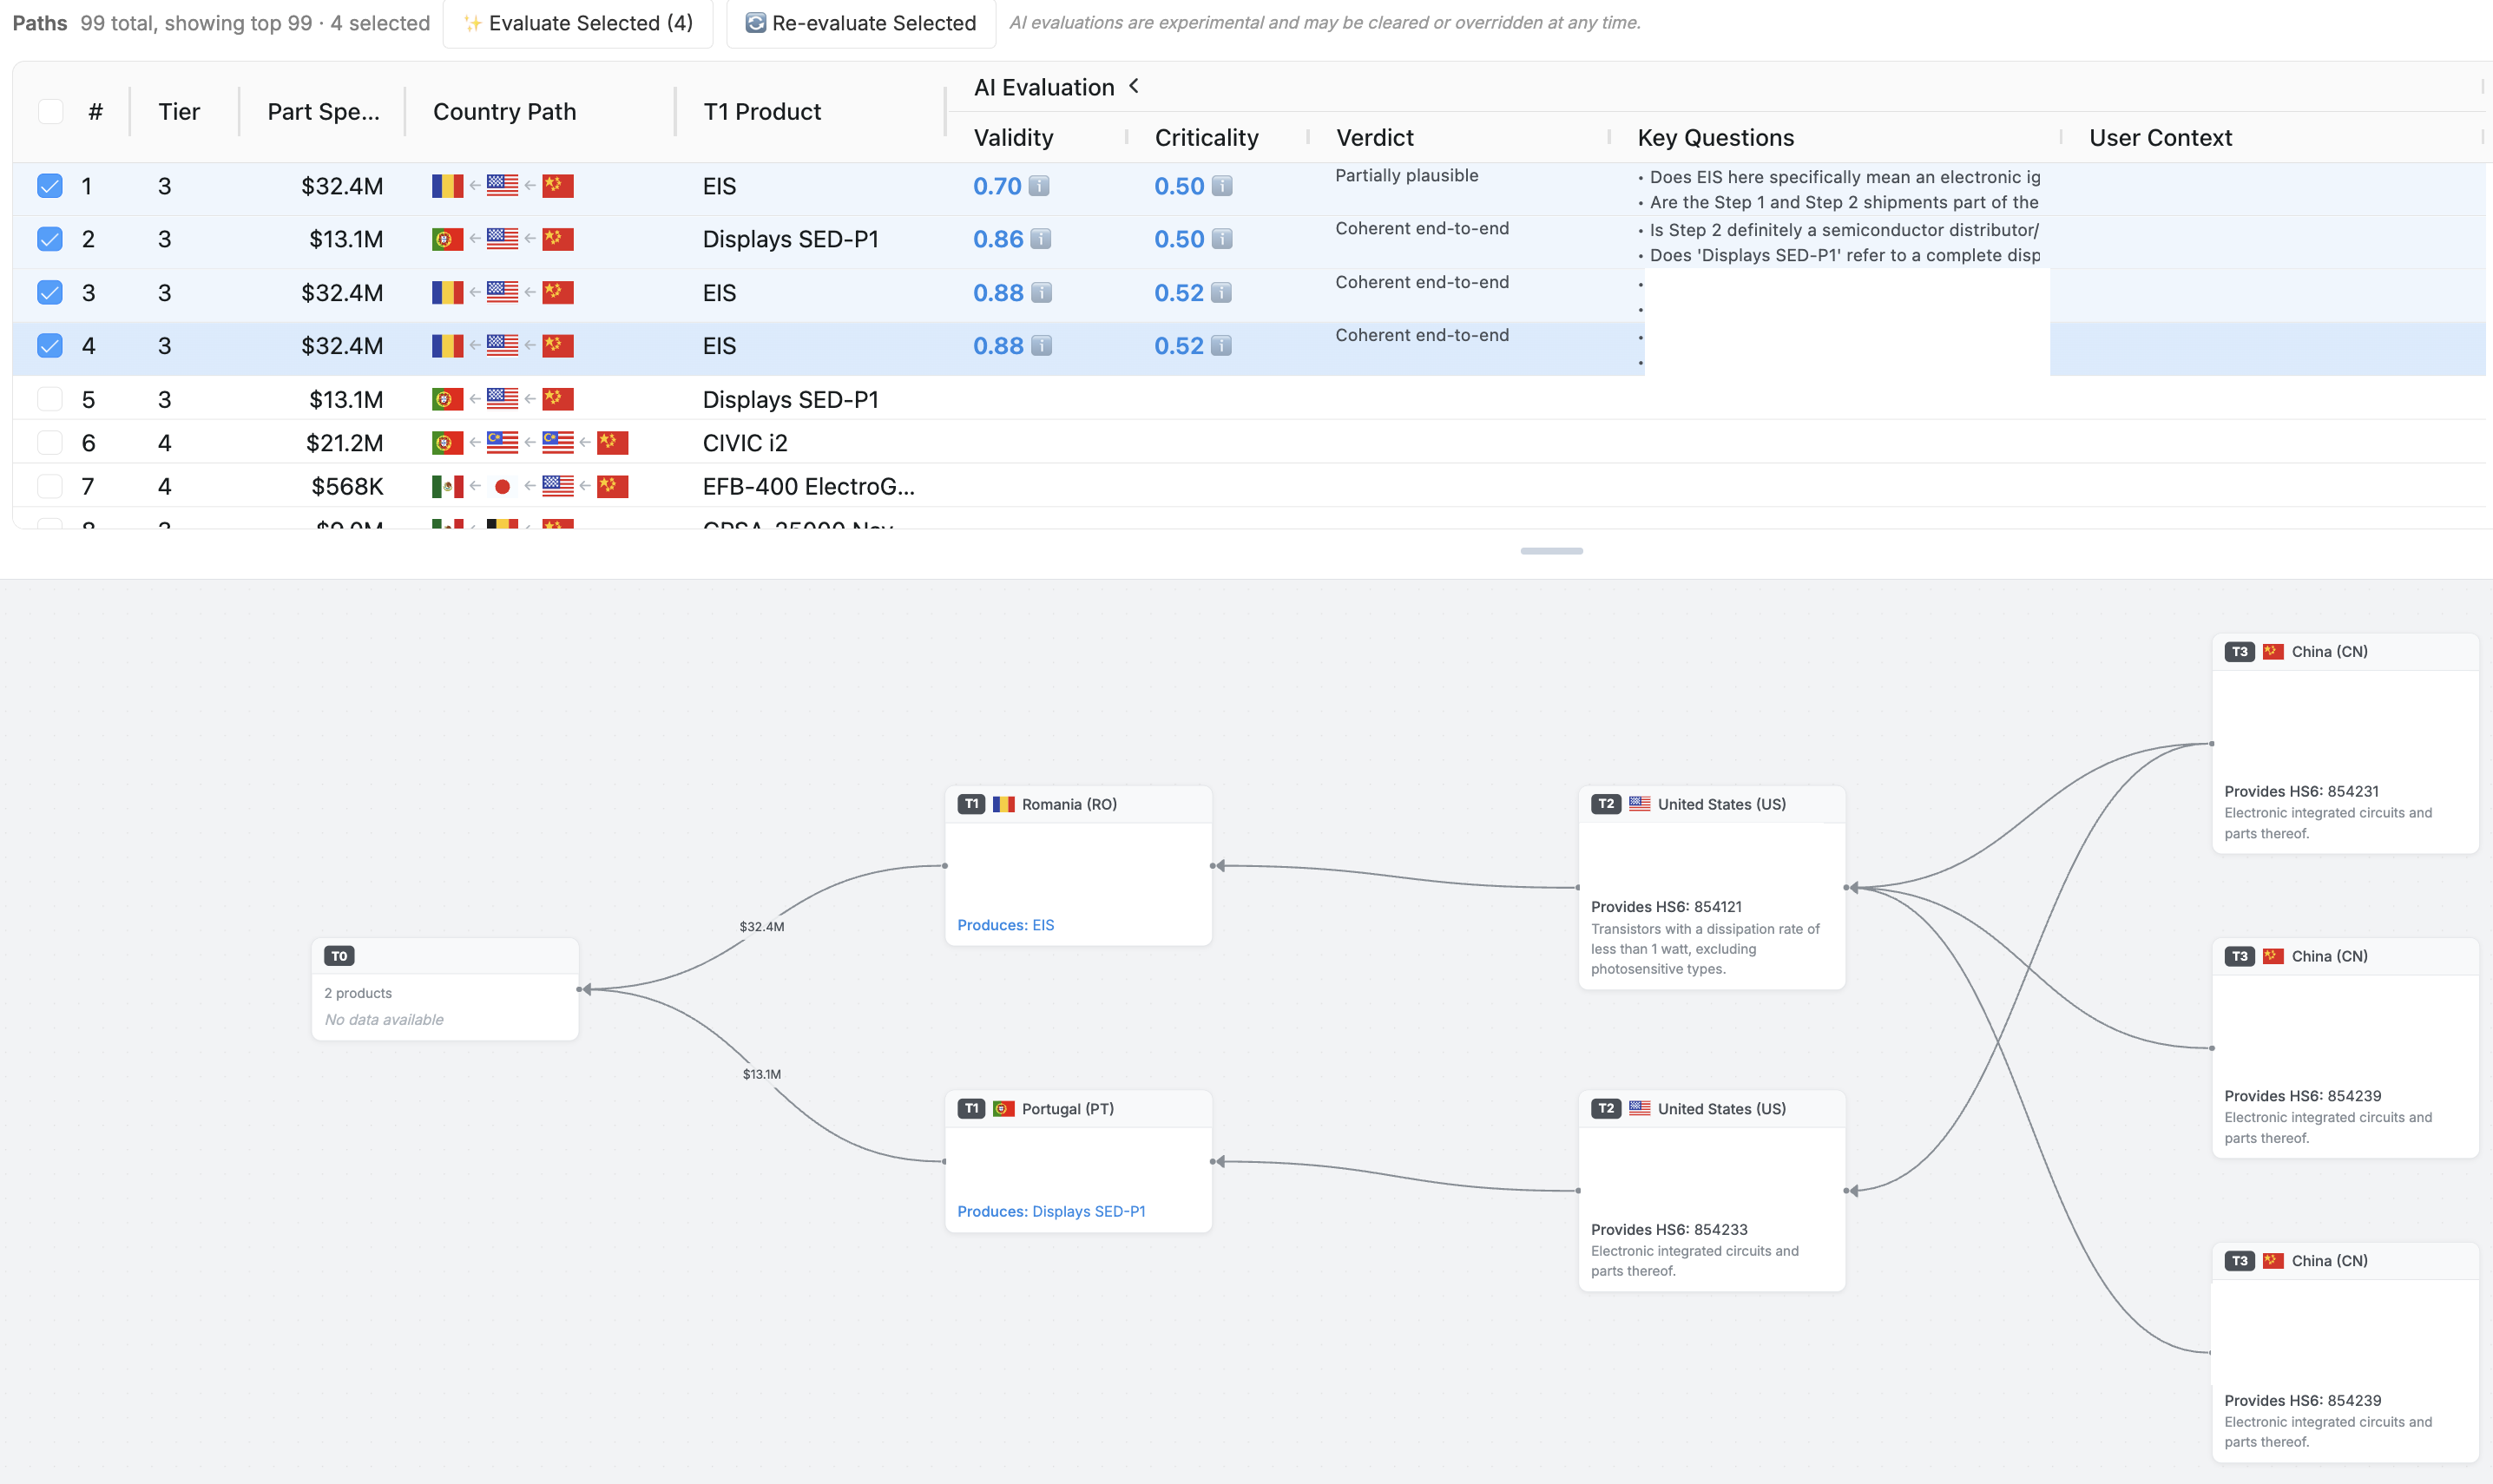
Supplier names and addresses are redacted in these Material Flows example screenshots.
Track events affecting your suppliers
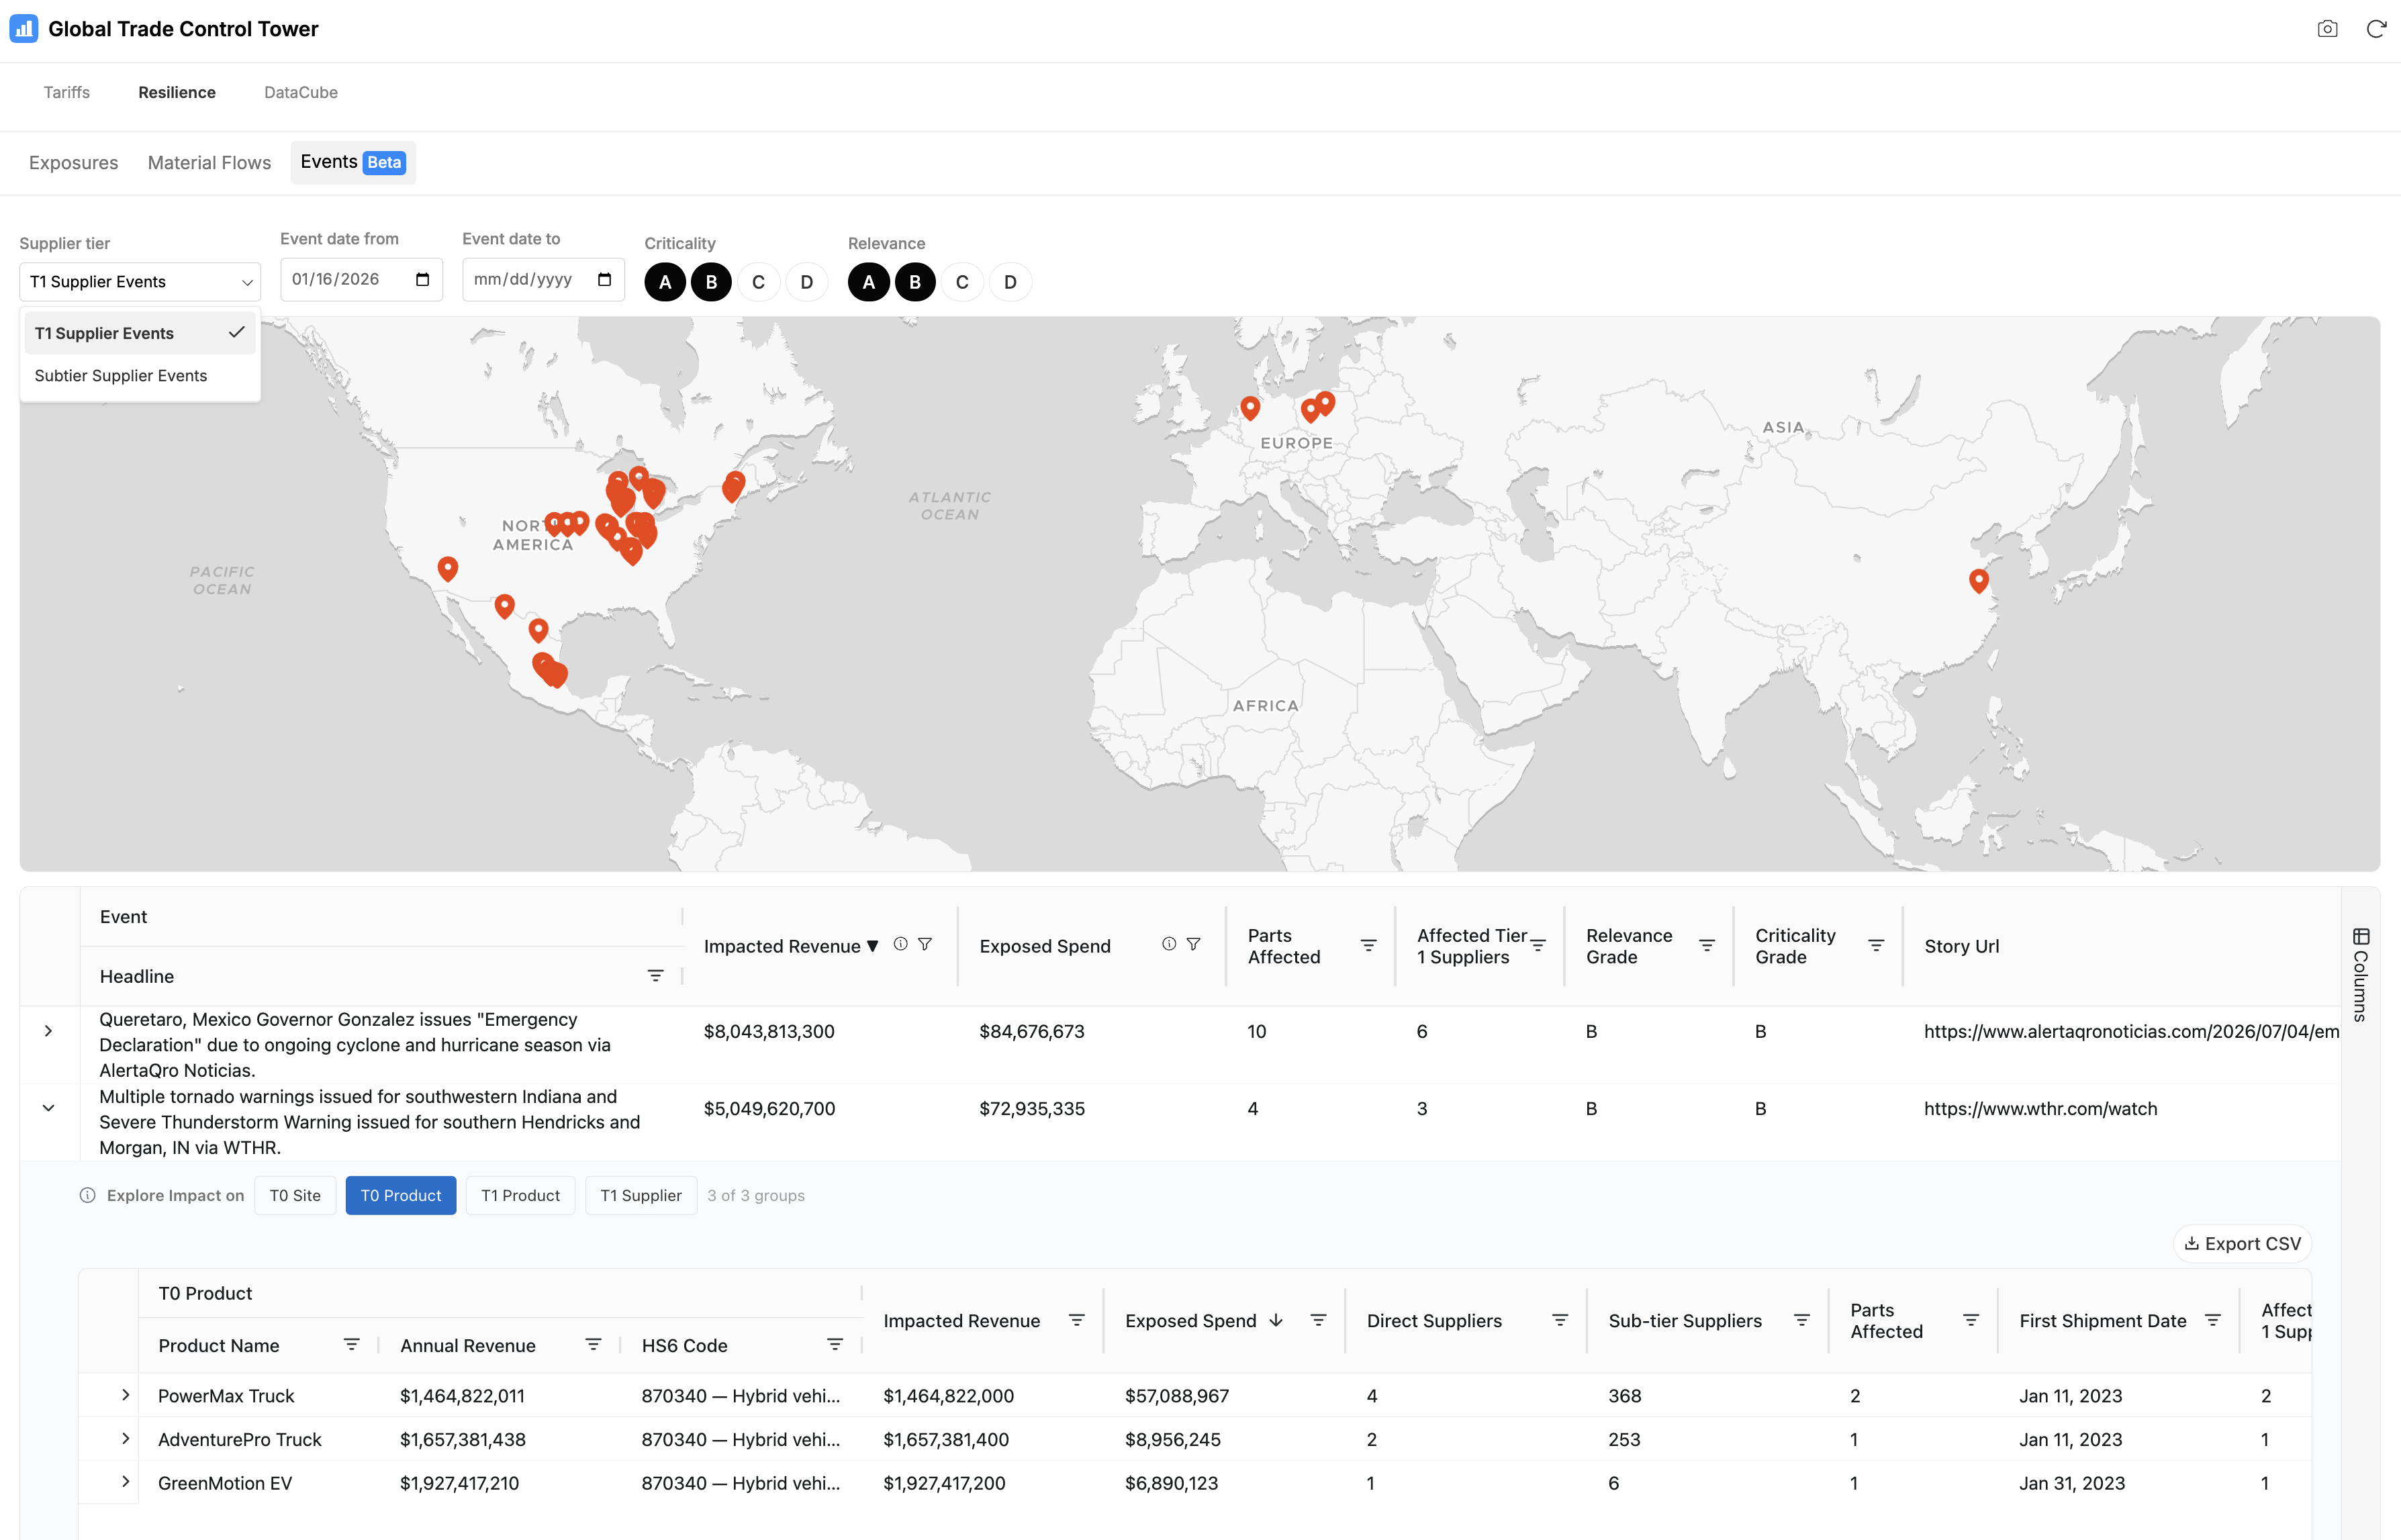
The Events view (early access) surfaces world events — weather, disruptions, and other news — that affect your suppliers, plotted on a map and listed with the revenue and spend they put at risk. Each event is scored for its criticality and its relevance to your manufacturing operations (graded A–D), so you can filter to the events that matter most. You can view events for your direct (Tier 1) suppliers or your sub-tier suppliers, filter by date, and explore each event's impact in the context of your Tier 0 sites, Tier 0 products, directly sourced (Tier 1) products, or direct (Tier 1) suppliers.
Outputs and interpretation
You get exposure measures that tie network dependencies to the revenue and spend behind them, along with indicators of single-source and bottleneck risk. Connections beyond your direct suppliers are inferred from Altana's product network, so review the supporting evidence before you act.
Constraints and caveats
- Sub-tier connections are inferred; confidence varies with network coverage.
- Business-impact figures depend on the completeness of your revenue and spend data.
- Scenario results reflect the assumptions you model; they are not a forecast.
Related
- Global Trade Control Tower — how Resilience fits with the other areas.
- Value Chains — how Altana represents multi-tier material flow.
- Exposure Terminology — how exposure is defined and measured.
- DataCube — explore these dependencies flexibly and ask the Multi-Tier Analyst Agent.