Understanding the Company Profile
The Company Profile gives you a structured, at-a-glance view of any company in Altana — surfacing key identifiers, ownership structure, risk exposures, financial data, and supply chain activity in one place. The redesigned profile is organized into tabs so you can quickly evaluate relevance and risk without leaving the product.
Opening a Company Profile
Select any company from your search results or from an exploration canvas to open its Company Profile. The profile opens in a side panel with tabs across the top.
Profile Tabs Overview
The Company Profile is organized into seven tabs:
- Overview — Top-line identifiers and summary signals
- Ownership & Management — Owners, subsidiaries, shareholders, and directors
- Transactions — Inbound and outbound trade activity
- Facilities — Map view of associated facilities
- Financials — Financial performance metrics
- Exposures — Risk exposure detail by category
- Additional Details — Extended data fields and notes
Filtering data within a profile
On the Ownership & Management, Transactions, and Facilities tabs, you can filter the data directly inside the profile — without starting a new search. This lets you cut a large profile down to the records you care about in a couple of clicks. There are two ways to filter:
- Exposure chips — click an exposure chip (for example, a sanctions or forced labor flag) to filter the tab's table to the rows carrying that exposure.
- Chart selections — click a segment of a summary chart (for example, a country in Transactions by Sender Country or a code in HS Codes Transacted) to filter the table to just that segment. The chart highlights your selection and the table re-queries to match.
Filters are additive, so you can stack a chart selection and an exposure chip to narrow the data further. Clear a filter to return to the full set.
Note: Filtering by exposure chip is available on the Ownership & Management and Facilities tabs. On the Transactions tab you can filter by chart selection today; filtering by exposure chip there is not yet available.
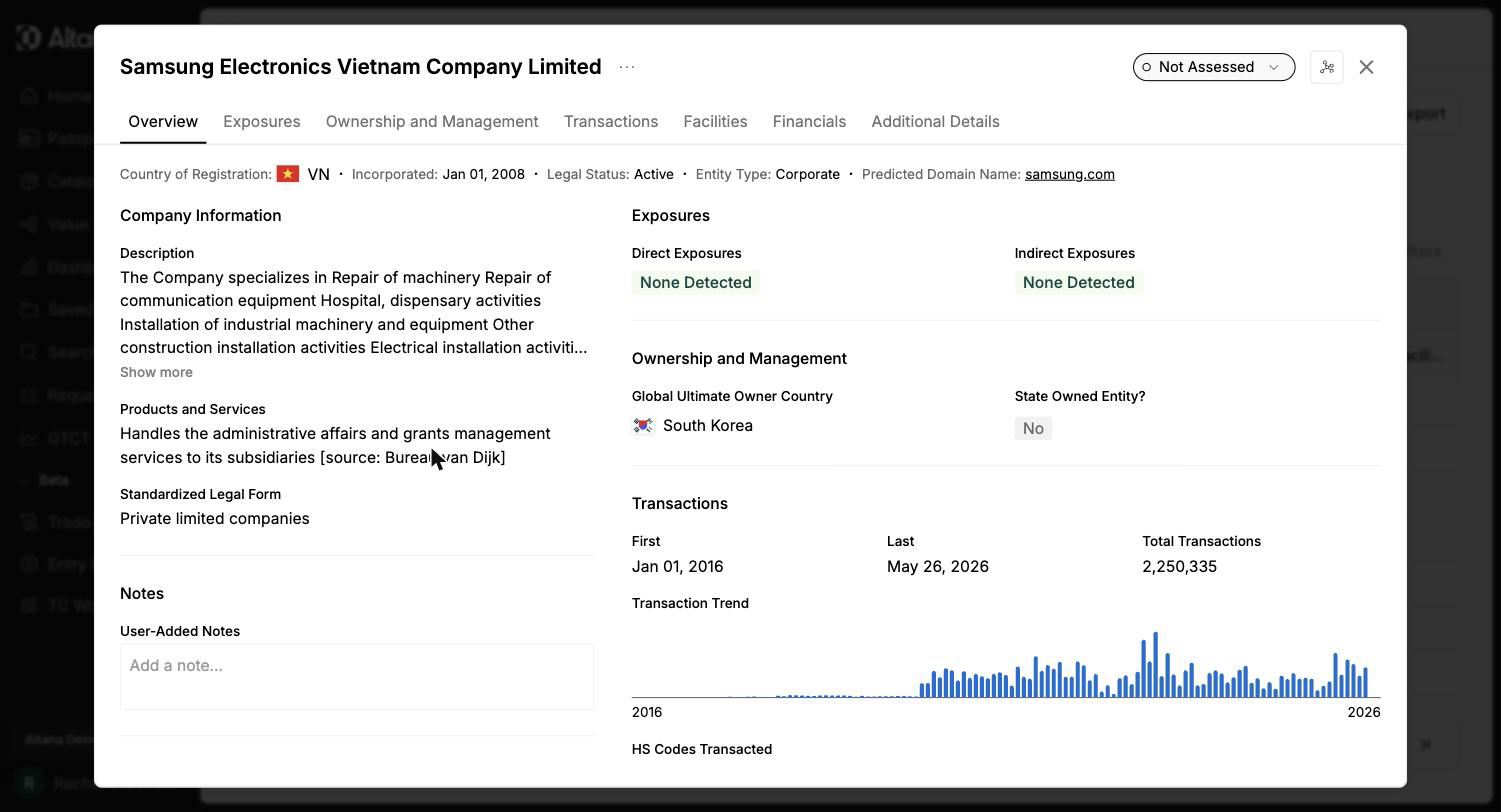
Overview Tab
The Overview tab is designed for fast verification. It surfaces the most critical company identifiers and risk signals at a glance:
- Company Type and standardized Legal Form
- State-Owned Entity (SOE) flag — indicates government ownership
- GUO Country of Registration — the country where the global ultimate owner is registered, shown at both 25% and 50% ownership thresholds
- Transaction trend — monthly shipment activity aggregated over time
- Facilities by predicted type — a breakdown of associated facility types
- Exposure summary — a quick count of direct and indirect risk flags by category
Ownership & Management Tab
The Ownership & Management tab consolidates the full corporate structure into four subtabs:
- Owners — Companies that own the focal company, sorted by ownership percentage
- Subsidiaries — Companies owned by the focal company, sorted by ownership percentage
- Shareholders — Individual and institutional shareholders
- Directors — Board members and executives, with name, date of birth, nationality, position type, and number of affiliated organizations
Ownership chips
Entities in the Owners and Subsidiaries grids display GUO (Global Ultimate Owner) and DUO (Domestic Ultimate Owner) chips at 25% and 50% ownership thresholds. These chips indicate the ultimate controlling entity in the ownership chain. Hover over a chip for a tooltip explaining what it means in context.
Exposure tags
Each entity in the ownership grid shows exposure tags indicating risk flags associated with that company or individual. Director and shareholder exposure counts reflect the number of risky companies in their network, not raw exposure counts.
Launching an exploration from ownership
You can launch a new exploration directly from any owner, subsidiary, director, or shareholder listed in this tab. This lets you pivot your investigation without returning to the search results.
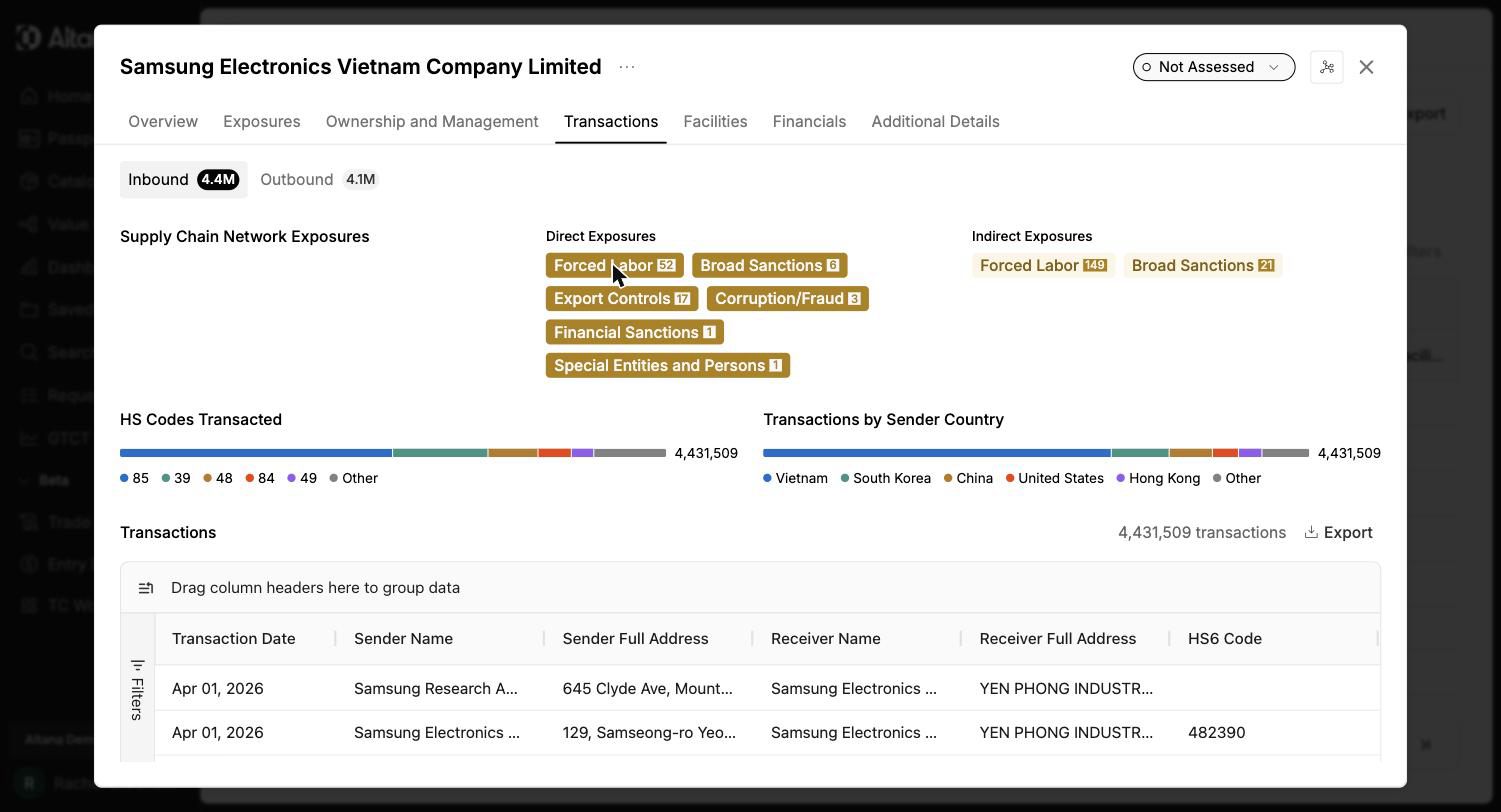
Transactions Tab
The Transactions tab shows the company's inbound and outbound trade activity in filterable tables. You can:
- Switch between Inbound and Outbound transaction views
- Filter the table by clicking a segment of the HS Codes Transacted or Transactions by Sender Country charts (see Filtering data within a profile, above)
- Narrow the table by date, partner, and other criteria
- Download the underlying data for either table using the per-table export button
- View supply chain network exposures associated with the company's trading partners
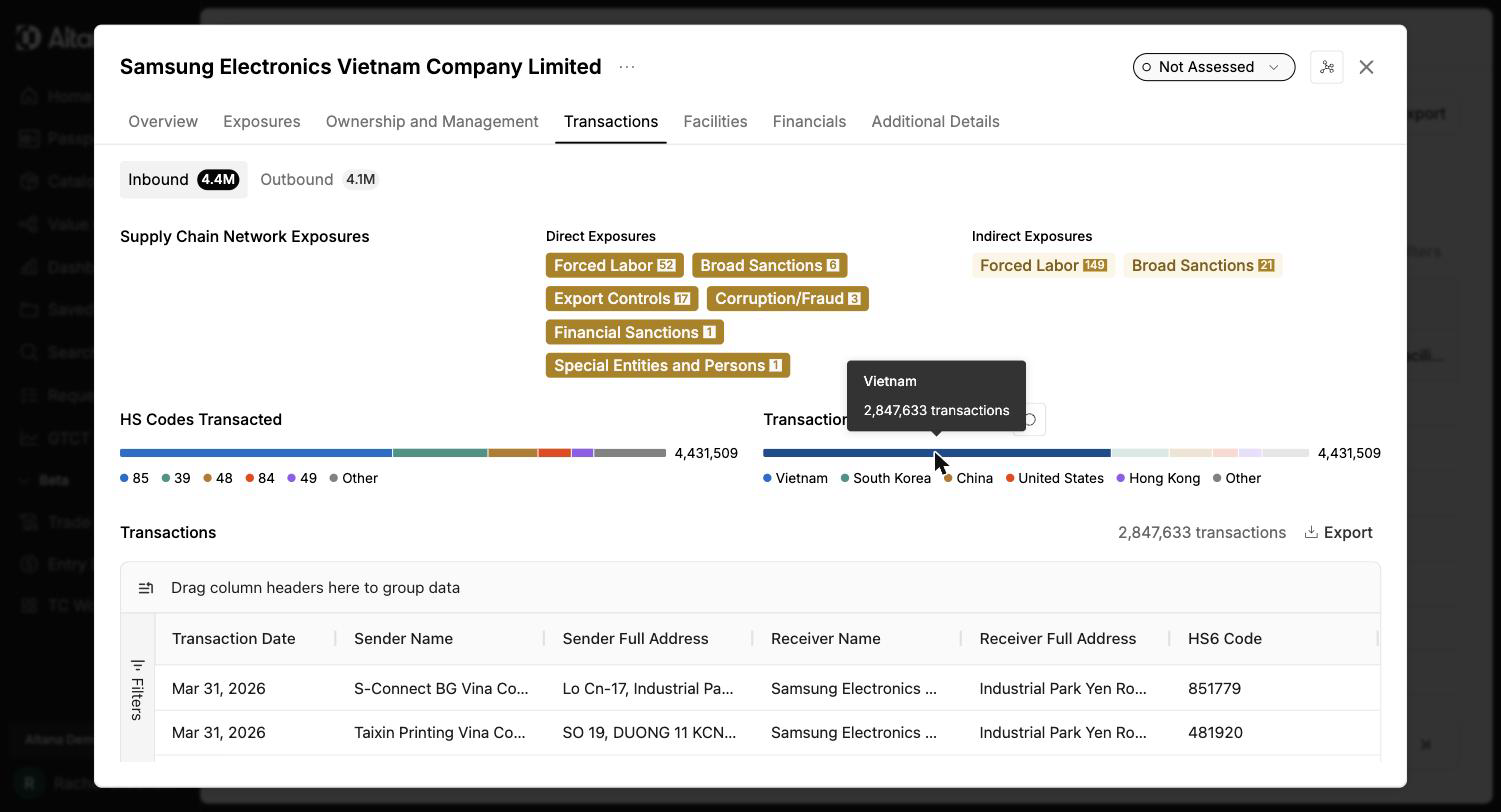
For example, clicking the Vietnam segment of Transactions by Sender Country filters the table from every transaction down to just those with Vietnamese senders. The full table:
And the same table after clicking the Vietnam chart segment, with the chart highlighting the selection:
Facilities Tab
The Facilities tab displays a map-based view of the company's associated facilities, along with a country-level breakdown and predicted facility type for each location.
Financials Tab
The Financials tab provides financial performance data sourced from Moody's. Available metrics include:
- P&L and Net Income
- Cash Flow and Total Assets
- Shareholder Funds and Current Ratio
- Profit Margin, ROE, and ROCE
- Solvency Ratio and Employee Count
- PE Ratio and Market Cap
Exposures Tab
The Exposures tab provides a detailed breakdown of the company's risk flags, grouped by exposure category (such as Forced Labor, Sanctions, and others). Use the Direct / Indirect toggle to switch between:
- Direct exposures — risk flags associated with the focal company itself
- Indirect exposures — risk flags present in the company's supply chain network (upstream and downstream trading partners)
Exposure counts reflect the number of distinct exposure types or risk lists hit, not the number of flagged entities. For example, if a trading partner appears on two forced labor lists, that counts as two forced labor exposures.
Additional Details Tab
The Additional Details tab contains a flat list of all extended data fields available for the company. Any Notes you have added to the company are also stored here.
Connected Organizations (Catalog-enabled accounts)
If your account has Catalog enabled, an additional Connected Organizations subtab appears within the Ownership & Management tab. It lists any Catalog organizations linked to this company, including the date they were connected and the number of attached documents. For companies not yet linked to a Catalog organization, the tab provides a link to Catalog with guidance on how to create the connection.
Key Details
- Ownership percentages are not displayed in the current version. They will be re-introduced in a future release once data quality improvements are complete.
- Financials data is available by default and does not require a separate license to view.
- Exposure counts on the Overview and Exposures tabs count distinct exposure types and risk lists, not the number of flagged companies. A company flagged on two lists in the same category counts as two exposures.
- Documents are no longer displayed in the Company Profile directly. If your account has Catalog enabled, documents are accessible through the Connected Organizations subtab.
- GUO chips — when both a 25% and 50% GUO chip would apply to the same entity, only the 50% chip is shown.
- This feature is available on Nexus.